 6S Teknoloji
Energy Monitoring and Management PlatformKnow what you'll paybefore the bill arrives.
One screen for your
Every meter on site is read continuously and turned into decisions on a single screen. Reactive penalties, budget drift, transformer overload — all in front of you before they happen.
- Brand independent
- On your server or in the cloud
- Local team, local support
Learning about it from the invoice is expensive.
6S Teknoloji puts the same problems in front of you before they happen. Keep scrolling.
The month-end bill is a surprise.
You find out how much you used when the invoice lands.
What changes with 6S Teknoloji? TapMonth-end is recalculated every day.
The projection engine updates the month-end amount daily from actual consumption and weekly patterns.
Reactive penalties show up on the invoice.
A failed compensation panel silently piles up penalties all month.
What changes with 6S Teknoloji? TapYou're warned as the limit approaches.
Cumulative inductive/capacitive ratios are continuously checked against EPDK limits; the email arrives before any penalty.
Transformer overload is found at failure.
Phase imbalance and overload stay invisible until a breaker trips.
What changes with 6S Teknoloji? TapLoad and phase balance, continuously tracked.
Load %, phase currents, PF and imbalance for every transformer; alarms with value and duration on breach.
The internet dropped, the data is gone.
The hours of outage remain as holes in your reports.
What changes with 6S Teknoloji? TapLinks break. Data doesn't.
The field agent buffers readings locally for at least 30 days; not a single row is deleted without a server ACK.
The budget lives in Excel. Nobody looks.
Drift only surfaces at year-end, when it's too late.
What changes with 6S Teknoloji? TapBudget vs actual, month by month.
Electricity, water and gas budgets are tracked automatically; drift is visible in the month it happens.
Chillers run unseen.
Setpoints, faults and run hours are unknown without a site visit.
What changes with 6S Teknoloji? TapBrand-independent chiller & VRF monitoring.
Water temperatures, compressor status, faults and signed remote setpoints — in one panel.
From field to decision. In four steps.
Every meter. Continuously.
Transformers, analyzers, water and gas meters, chillers, UPS, generators… read at configurable intervals over Modbus, M-Bus, SNMP, BACnet/IP and LoRaWAN.
Links break. Data doesn't.
The field agent writes every reading to a local queue first. Even after hours offline, no hour goes missing when the link returns.
Not charts. Answers.
Power quality becomes one score, the worst panels are ranked, alarms arrive with value and duration. The system tells you where to look.
In management's language: money and budget.
Budget vs actual month by month, a month-end projection updated daily, carbon report ready. Walk into the meeting with answers, not screenshots.
Every module. At a glance.
These are illustrative drawings made to explain each module; we walk through the real interface together in a demo call. Tap the glowing dots.
Tap one moment. Every chart goes there.
Pick a time on one chart and the same moment is marked on every other chart and on the status timeline. What were power and CO₂ doing while the temperature climbed — at a glance.
Tap the chart or slide your finger sideways.
6S Teknoloji in ninety seconds.
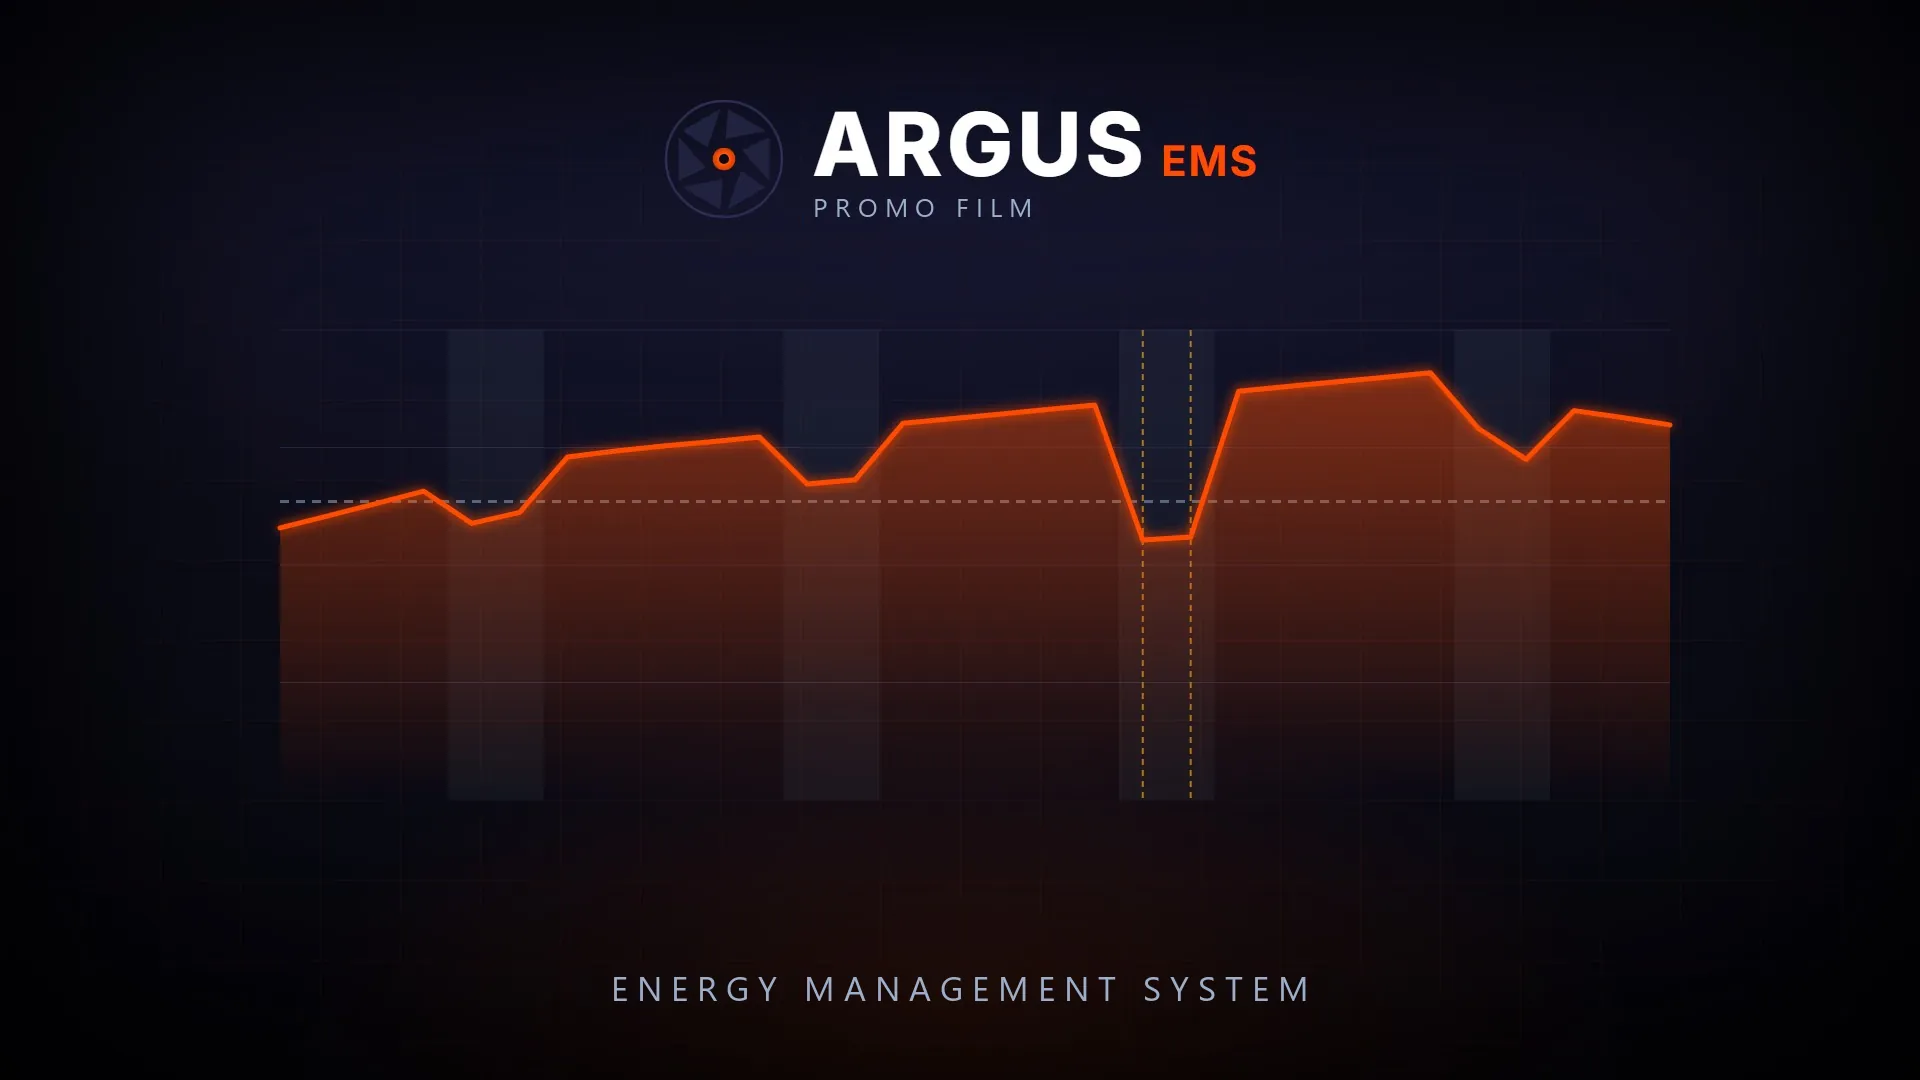
The whole flow, from the meter on site to the management report, in one film.
Not separate tools. One brain.
Reactive penalty shield
Inductive and capacitive ratios are tracked against EPDK limits all month — and the compensation panel's health too.
Details →Transformers & power quality
Load, phase imbalance, PF, THD — per transformer, continuously.
Details →Budget & month-end projection
A month-end forecast updated daily with weather and occupancy data.
Details →Smart alarm engine
Noise-free, thresholded alarms with consecutive-breach checks; by email.
Details →Chillers & VRF
Brand-independent monitoring, fault history, signed remote setpoints.
Details →Water & natural gas
Main meters, sub-meters and utility-portal data in one place.
Details →Billing
Consumption invoices per tenant and unit, automatic with tariffs.
Details →Carbon & ISO 50001
Scope 1 and 2 emissions calculated monthly; data ready for ISO 50001 reporting.
Details →Whatever is on site speaks.
We connect to your existing meters and devices without replacing them. The field agent connects outbound — no inbound ports on your firewall.
- Transformer
- Energy analyzer
- Compensation
- UPS
- Generator
- Chiller
- VRF
- Water meter
- Natural gas
- EV charging
- LoRa sensor
Your building is different. The platform is the same.
Hospital
A watchman for transformers, UPS and generators in buildings that can't afford downtime.
Shopping mall
Per-tenant consumption and automatic billing.
Factory
Energy intensity per line, panel and shift.
Hotel
Consumption and HVAC control by occupancy.
Residential
Per-flat water and heat share, transparent billing.
Solar plant
Generation, consumption and netting on one screen.
Don't guess the next bill.
Know it.
Tell us about your facility; together we'll map what you can monitor with the meters you already have.
What You're Wondering
The most frequently asked questions about setup, protocol support and data security.
Energy Management Guide
Technical content on reactive energy, transformer monitoring and OSOS.